Project Overview
Background
Winchester, as one of England's oldest capital cities, holds an extraordinary density of heritage — yet its stories remain largely invisible to everyday passers-by. Grounded in the theory of psychogeography, this project explores how historical landmarks along my daily routes carry personal memory, emotion, and cultural meaning beyond their physical coordinates.
Outcome
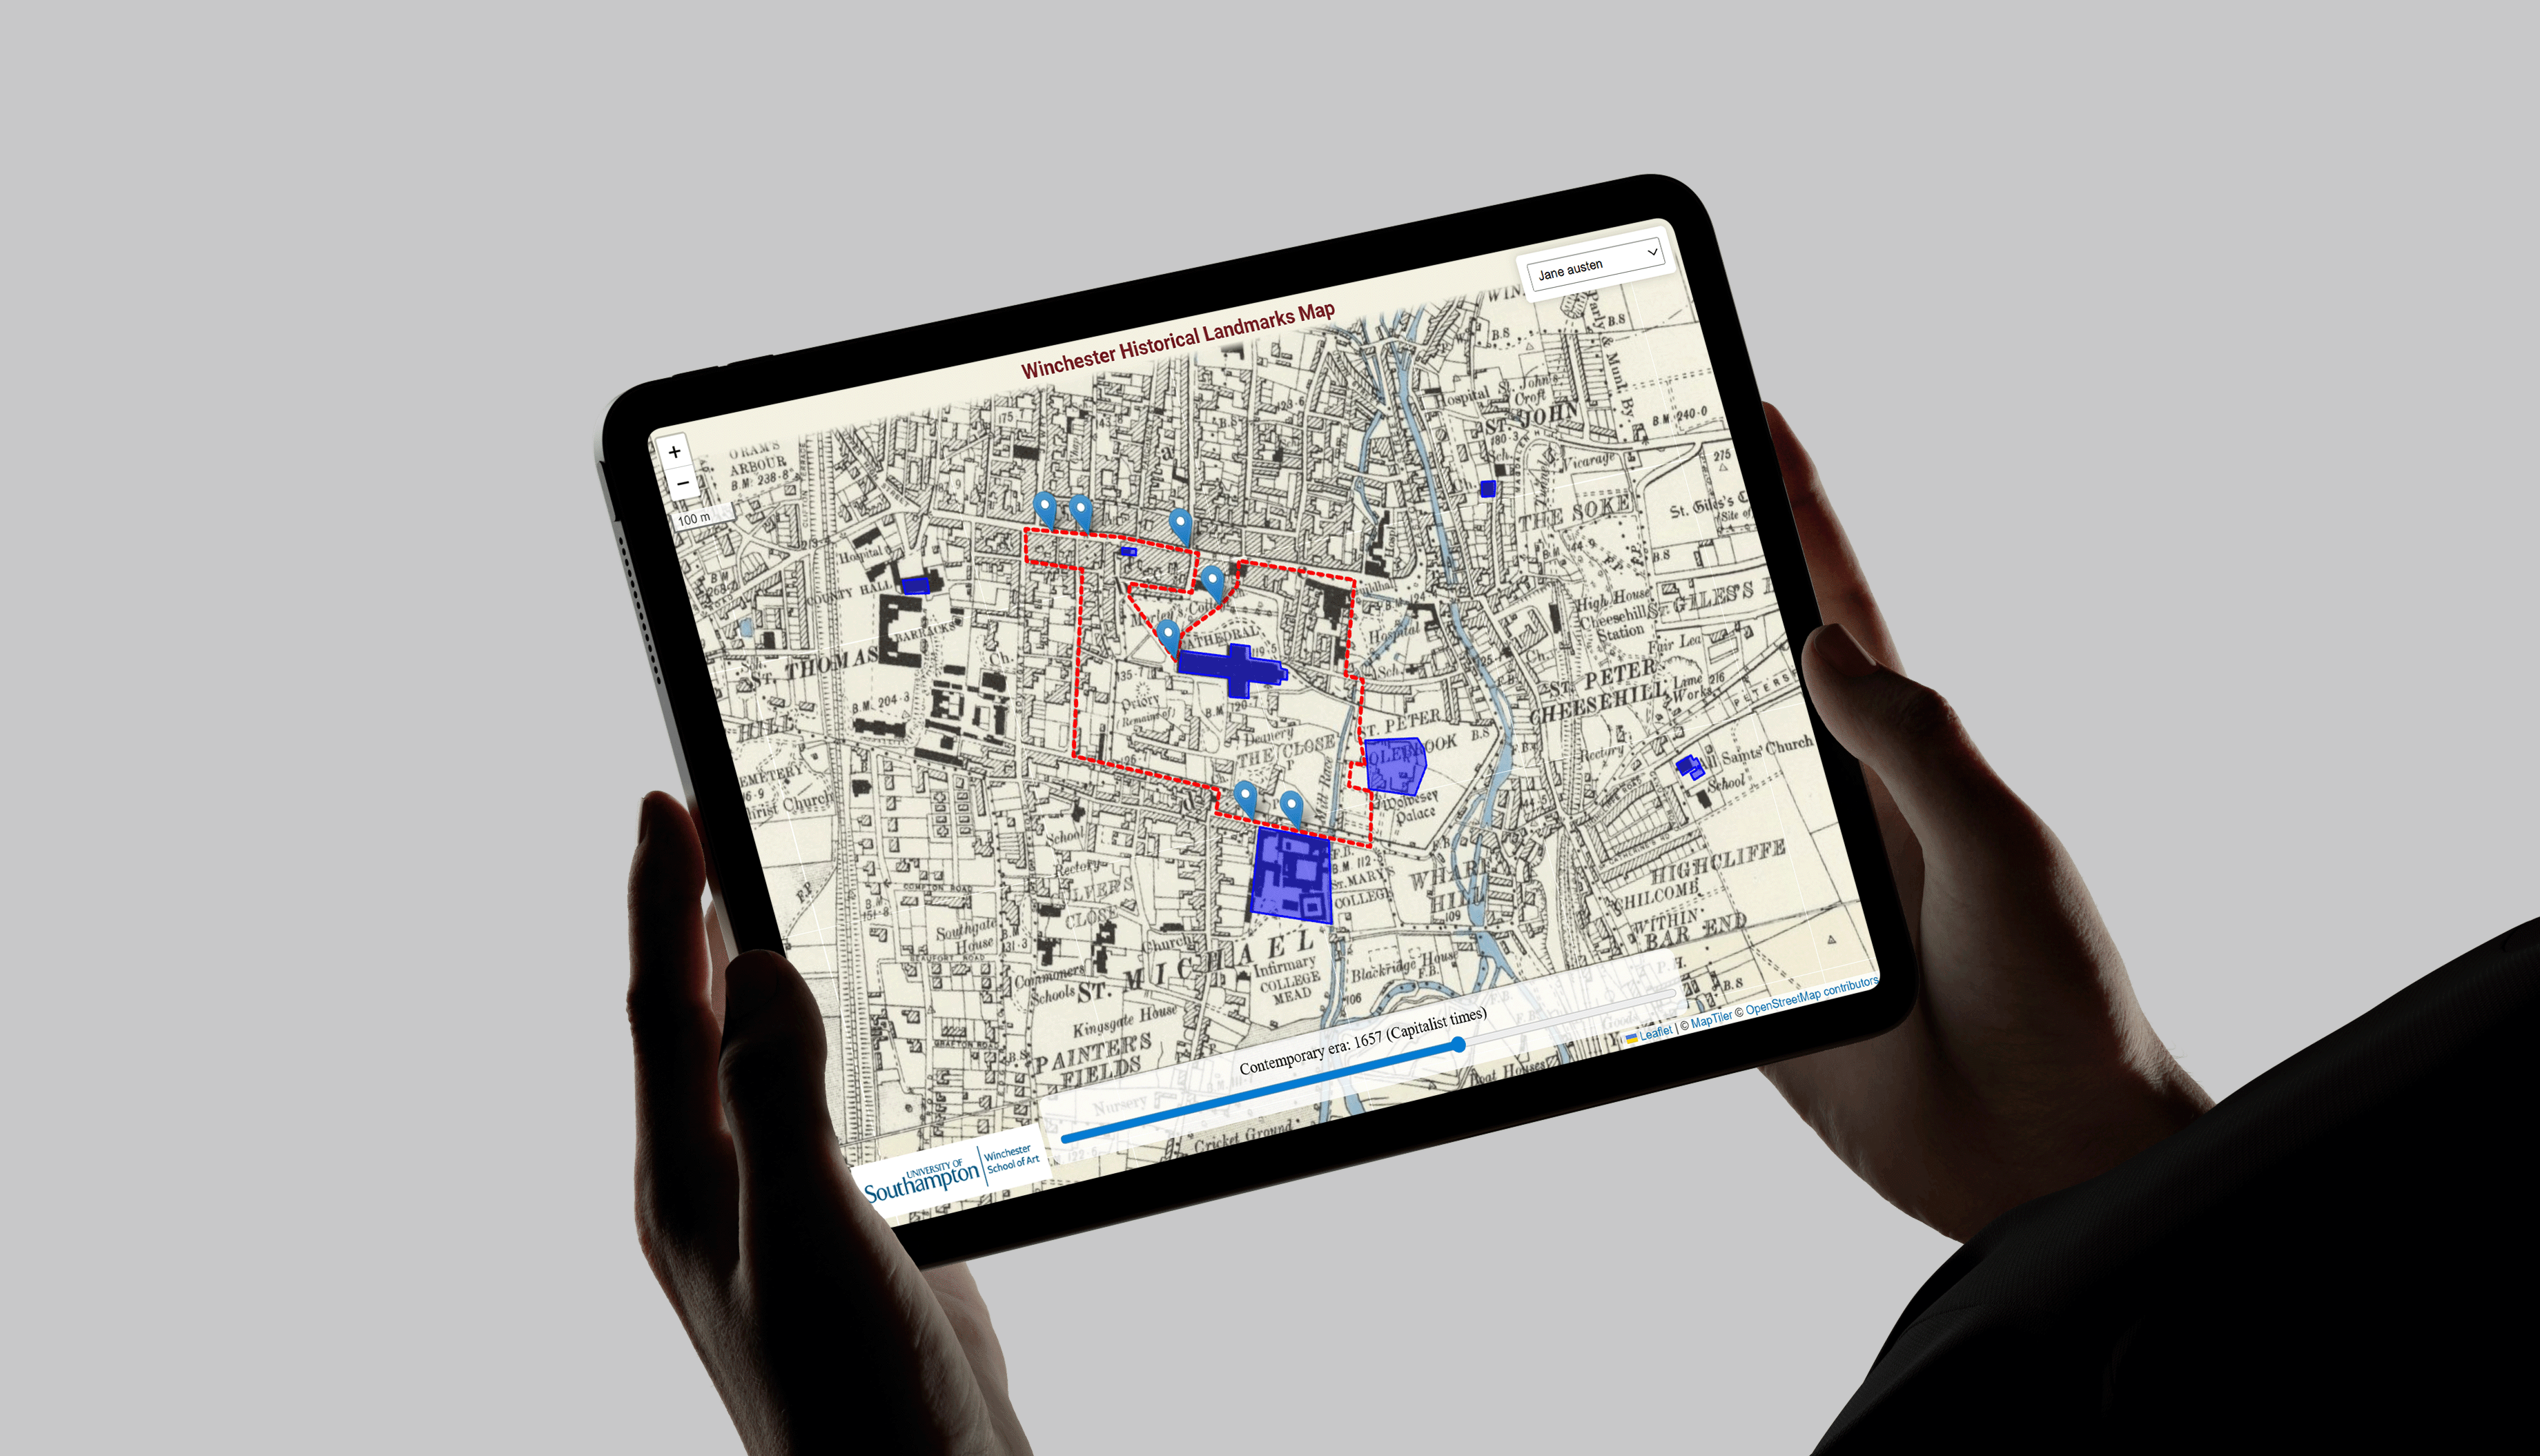
An interactive web map built with Leaflet.js and GeoJSON, overlaid onto an Ordnance Survey map from 1888–1913. Users can click landmarks to reveal layered narratives — historical events, personal reflections, and fictional vignettes — and explore routes across time via a built-in timeline slider.
Project Report
The full project presentation is embedded below — covering the conceptual foundation in psychogeography, the selection logic for each landmark, the development process from hand-drawn sketches to coded map, and a final reflection on what mapping emotion revealed about the city.
Explore the Map
The interactive map is embedded below. Click on any landmark marker to reveal its story — historical accounts, personal reflections, and narrative vignettes. Use the timeline slider at the bottom to shift between historical eras and watch the map layer respond.
How It Works
Each landmark is stored as a GeoJSON feature carrying historical metadata — name, year, narrative text, and image source. Clicking a marker opens a sidebar panel with the full story. A timeline slider at the base of the map filters visible landmarks by era, allowing users to experience the city across different historical periods. Route layers are toggled via a dropdown selector, tracing thematic paths through Winchester's past.
Key Takeaways
What I learned
• Maps as emotional media: A map is not merely a representation of space — it can hold memory, feeling, and narrative. Embedding stories into coordinates transforms geography into emotional landscape.
• Translating the abstract: Psychogeography gave me a framework for converting subjective urban experience into structured, interactive design decisions — from landmark selection to storytelling tone.
• Everyday paths as design material: The most meaningful locations were often the ones I passed through daily without thinking. Slowing down to examine those routes revealed layers of history I had walked over without noticing.
Limitations & next steps
Current limitations
• Emotional narratives are inherently subjective — different users bring different readings to the same location.
• Users who do not click every marker miss the connective thread between stories.
Future priorities
• Automated storytelling: Introduce guided tour modes so the map can narrate a path without requiring manual exploration.
• Multimedia layers: Add archival audio, period photography, and hand-drawn illustration segments to deepen immersion.
• Expanded timeline: Extend the historical range further back, and refine the slider to surface richer chronological contrast between eras.