Project Overview
Background
Grounded in Baudrillard's theory of symbolic consumption and Dunne & Raby's critical design approach, this project asks a deceptively simple question: where did my money go? By recording every purchase made since arriving in the UK — what it was, where, when, and why — the map becomes a personal archive and a commentary on consumer behaviour under globalisation.
Outcome
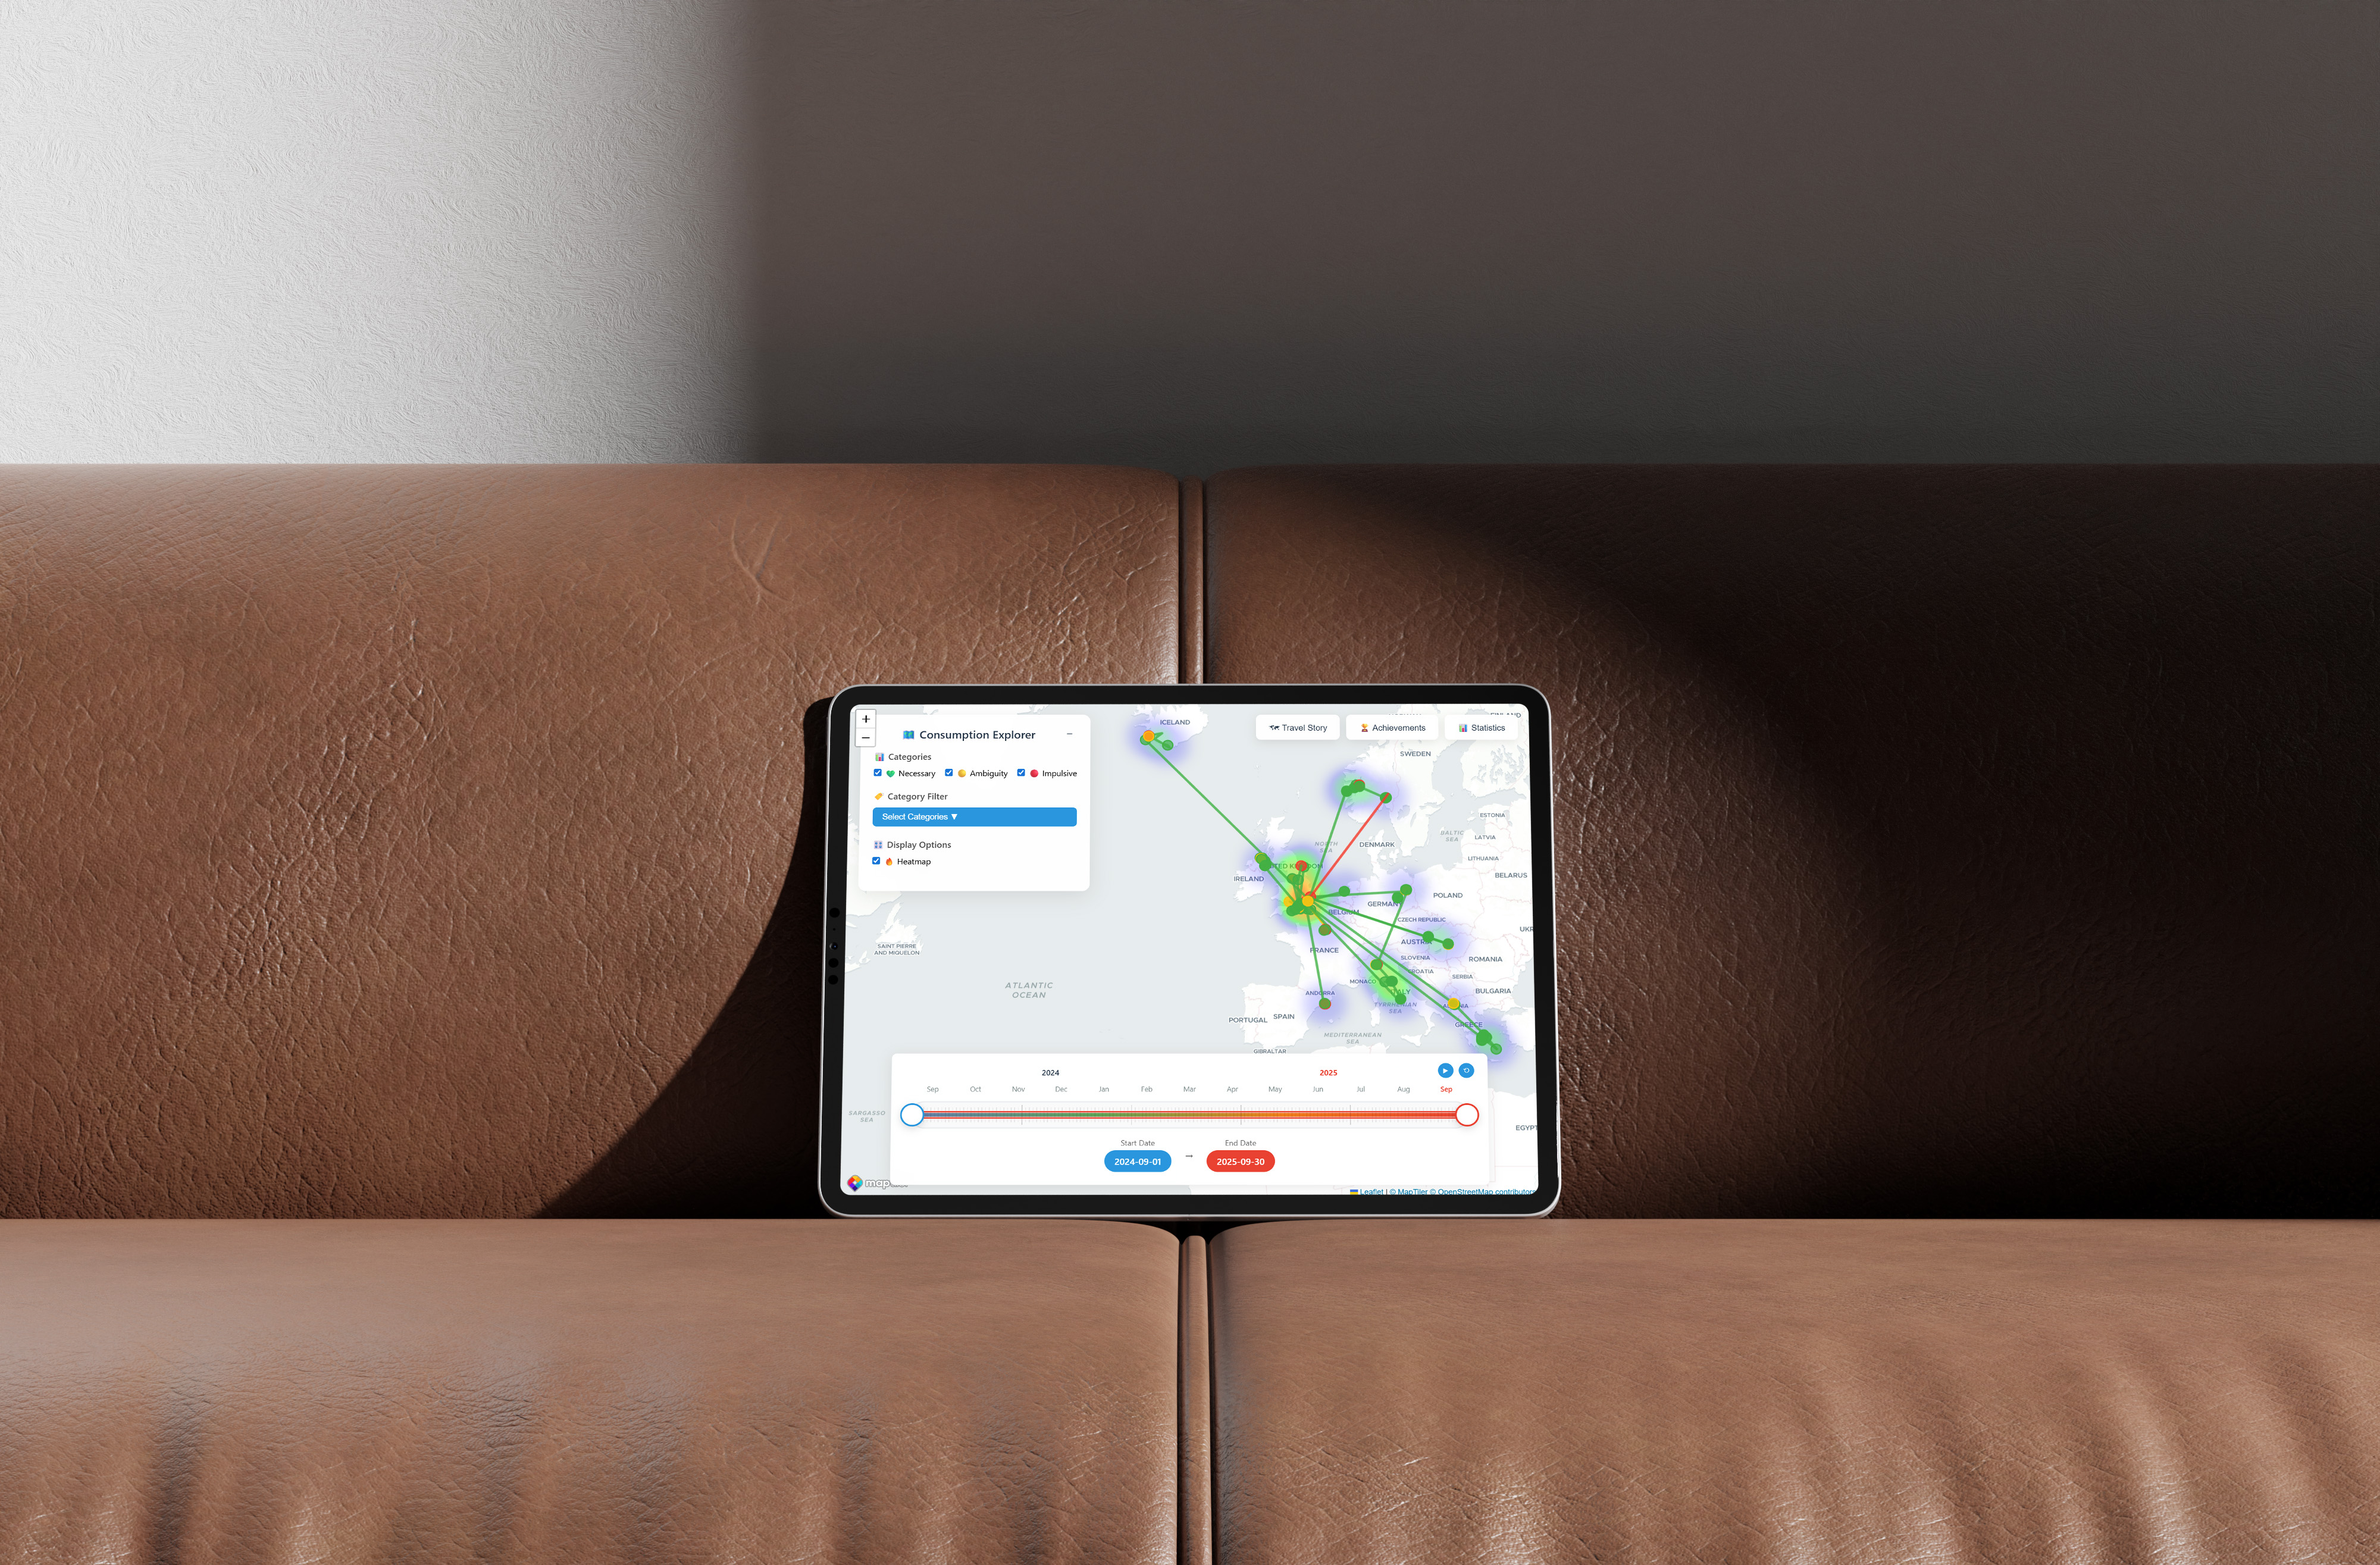
An interactive web platform hosted at 2025.macd.work/ll10y24 ↗ — featuring a geolocation-based consumption map, Story Mode travel chapters, a heatmap view, achievement system, and statistical data visualisations across 12+ countries and £8,000+ in tracked spending.
Three Types of Consumption
All purchases are classified into three categories, each with a distinct colour on the map, enabling users to visually interrogate the balance between rational and irrational spending.
"I buy, therefore I am — but where did it all go?"
Project tagline, informed by Baudrillard (1998): consumption concerns symbols rather than use valueThe A/B Manifesto framework — asks questions / narrative of consumption / design for debate / make us think — guided every design decision, positioning the project as critical reflection rather than celebration of spending.
Explore the Consumption Map
The full interactive experience is live at the link below. Click to open the project website in a new tab — use the map to browse purchases by location, filter by consumption type, toggle the heatmap, and enter Story Mode to follow spending across each country visited.
Where Did My Money Go?
Interactive consumption map · Story Mode · Achievement system · Statistical charts · 12+ countries · £8,000+ tracked spending
Key Features
• Interactive Map: Location markers coloured by consumption type, with a timeline slider spanning September 2024 – September 2025.
• Data Cards: Click any point to view item, price, category, date, and personal reflection notes — with embedded photos and videos.
• Story Mode: Plays the spending journey country by country, like a film — with chapter statistics and pie charts per destination.
• Heatmap View: Visualises spending density as an urban data overlay, revealing where money concentrates in space.
• Achievement System: Hidden badges reward exploration — "Arctic Explorer", "First Time", and more — designed to increase playability and repeat engagement.
Project Documents
The project presentation and sketchbook are embedded below. The presentation covers the conceptual framework, key features, and reflections. The sketchbook traces the full development — from the initial A/B Manifesto ideation through wireframes, Story Mode design, and the Achievement system logic.
Project Zine
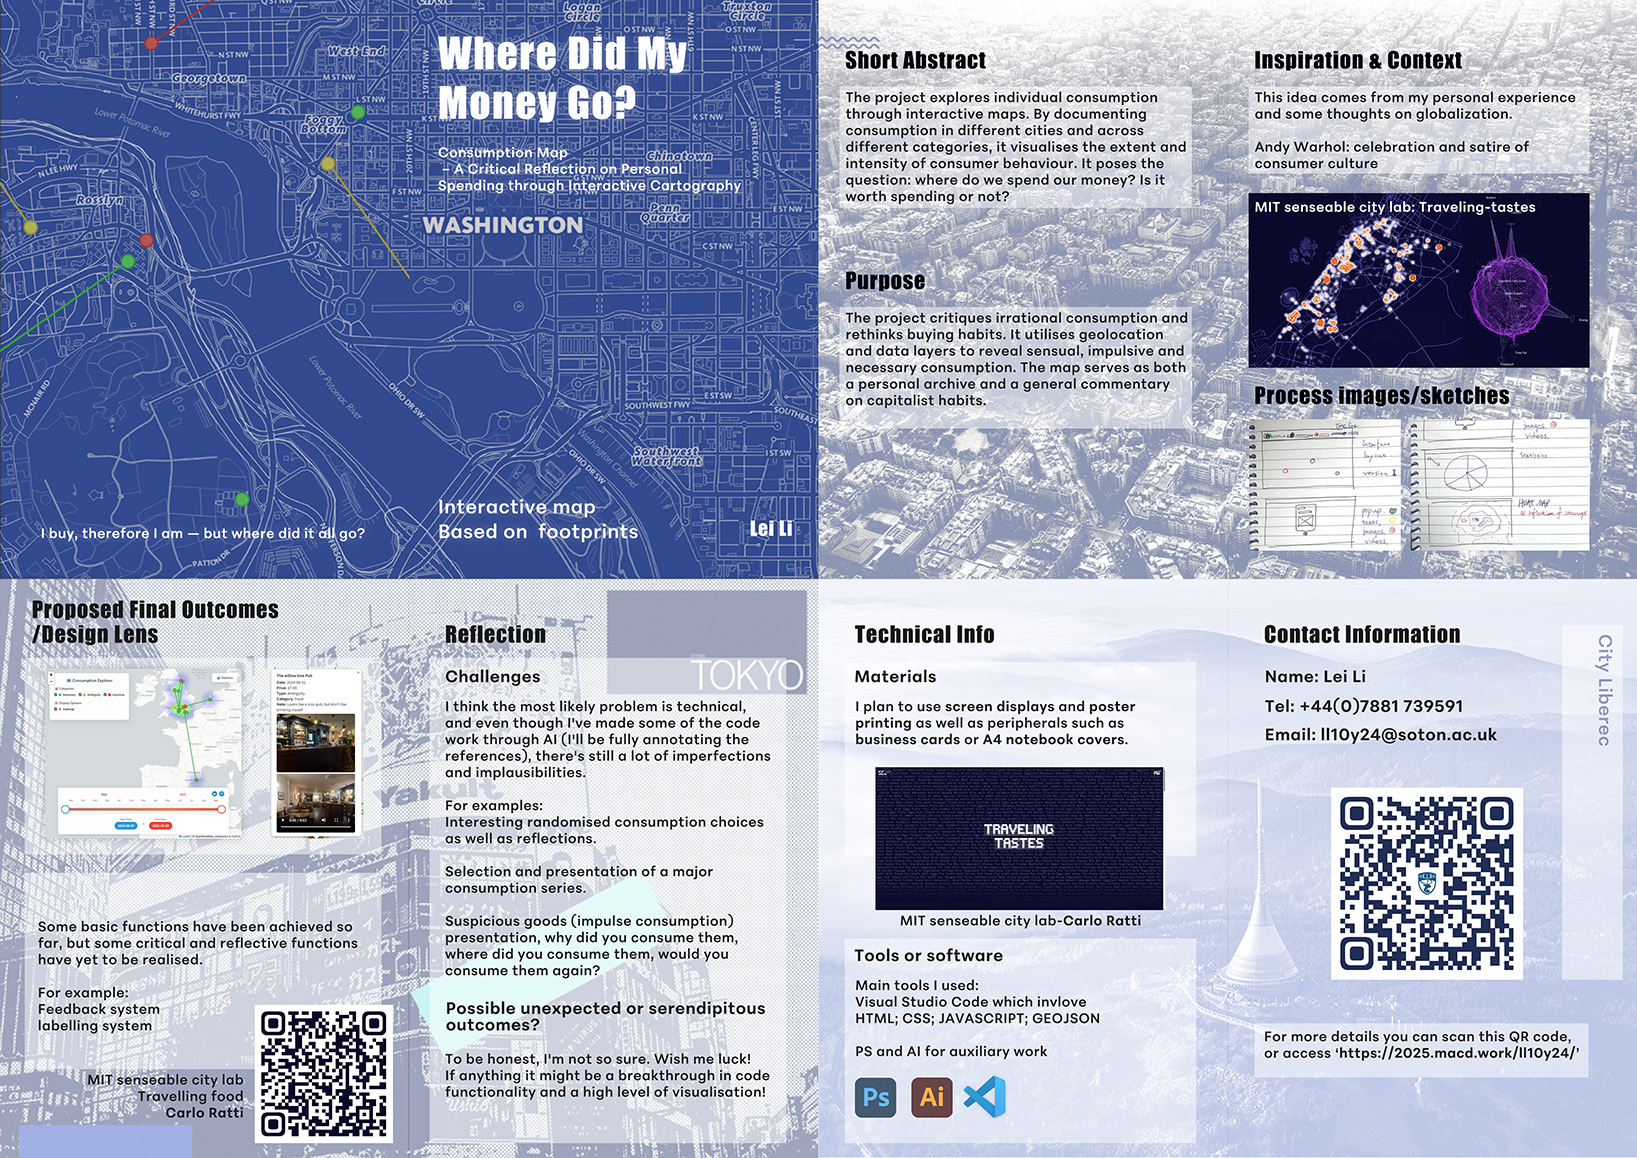
Project Zine — A/B Manifesto presentation board
Key Takeaways
What I learned
• Data as self-portrait: Recording every purchase transformed abstract behaviour into a visual narrative — the map revealed patterns I hadn't consciously noticed, including just how geographically clustered impulsive spending tends to be.
• Critical design through interaction: Making users click to reveal personal reflections — rather than simply displaying data — shifted the experience from information display to empathetic introspection.
• Playability as a design value: The Achievement system and Story Mode were not decorative additions; they meaningfully increased engagement and encouraged users to explore further than they otherwise would.
Challenges & limitations
• The dataset is inherently personal — limited to one person's behaviour, which restricts generalisability but deepens authenticity.
• Technical complexity (Leaflet, D3.js, GeoJSON, Story Mode logic) required AI-assisted development; all site selection, narrative writing, and critical framing remain original.
• Balancing visual appeal with academic rigour — the interface must feel engaging without obscuring the critical message.
Next steps
• Animation paths: Refine travel route animations to better communicate the movement between locations over time.
• User participation: Explore allowing visitors to compare their own spending patterns against the dataset.
• Additional data: Continue tracking and incorporating new countries and categories into the final submission build.